Showing posts with label Best online share trading. Show all posts

Thursday, May 12, 2011

TECHNICAL ANALYSIS On UNITED SPIRITS LTD (MCDOWELL & C) And Lupin LTD

United SpiritUnited Spirits (USL) is the largest spirits company in India and a flagship entity of $2 billion UB group. It manufactures wide range of whisky, vodka, rum and other spirits. United Spirits is among the top three spirits companies in the world. It has a presence in over 59 countries. USL's technical centre is located in Bangalore, which develops new products, conducts research and development, flavor testing and quality management. It has 62 manufacturing units. The company has received recognition for its quality products from independent jury such as International Wine & Spirits Competition (UK), International Spirits Challenge (UK), World Beverage Competition (US), Monde Quality Institute (Belgium) and Mundusvini (Germany). India's changing demography presents a significant opportunity for United Spirits to tap especially in the prestige segment. The company currently operates at 53 percent share-points in the segment. McDowell's No. 1 Platinum was launched in March 2010, is available in packs of 750 ml, 375 ml and 180 ml and is a part of Rs 8,300 crore McDowell's franchise.

On technical perspective, stock currently shows significant correction from the highs of Rs 1688 however we believe it's a temporary one and we might see some buying opportunities in the near term. Nevertheless its technical indicators i.e. RSI and MACD also revealed some technical pull back in near term.

Lupin LTDLupin is a transnational company engaged in development of APIs, generic and branded formulations. It is the largest manufacturer of Tuberculosis drugs in the world. It has onshore and offshore presence of its products in 70 countries. Its manufacturing unit is located in Goa, Tarapur, Ankleshwar, Jammu, Mandideep, Indore, Aurangabad and Kyowa in Japan. The manufacturing facilities of the company are approved by various international regulatory agencies like US FDA, UK MHRA, TGA Australia, WHO, and MCC South Africa. We expect Lupin to start API supply to Salix after a couple of years (~ in FY2013). The scale up in the deal clearly outlines the high probability of success for the drug to commercialise. Further, an approval for new indications would lead to higher API supplies and royalties in future. At the current market price of Rs440, the stock trades at 18.3x FY2012E fully diluted earnings and at 15.8x FY2013E fully diluted earnings. We maintain our Buy recommendation on the stock with a price target of Rs480.

On technical viewpoint, stock has shown upward bias after having consolidation around Rs 420. In close proximity we believe stock is well poised to move in upward direction. Moreover it's RSI and other technical indicators stands in the positive territory where possibility of turnaround couldn't be rule out. Hence investors are advised to BUY this stock for a price target of Rs 470-480 in near term.

Read more about  Mansukh monthly magazine report on Indian Stock Market

Mansukh brings to you the most updated monthly magazine which will not only help you in understanding online share market but will also help you do your own Analysis conveniently and smartly. Mansukh is providing derivative trading and Technical Analysis for last 15 years. For all the latest happening of the market please visit http://moneysukh.com

Wednesday, April 20, 2011

IS GOLD STILL AN EFFECTIVE U.S. DOLLAR HEDGE?

Equity Research Report
During the first nine years of this gold bull market, gold prices moved with a near perfect inverse relationship to the US dollar. Indeed, in the early years gold was only really moving up against the greenback, it was only after a few years that it began to appreciate against all currencies. The game plan was simple; the dollar is going down, so gold in USD terms is going up with some leverage factor. Gold worked well as both a USD hedge and as a tool to speculate on a USD decline. This is no longer the case.

 Nothing lasts forever and over the past two years or so this inverse relationship has broken down significantly. The gold story is no longer simply a USD devaluation play. Relationship remains intact, there are long periods where gold and the USD move together.

Gold Price?The most significant reason for this is that the Euros are a lot less desirable than they were a few years ago. Since all currencies trade on a relative basis, it doesn't matter if the USD has poor fundamentals; if the picture for the Euro is worse relative to the USD, then the greenback will make gains against the Euro. During periods where the Euro zone debt crisis has been the focus of market attention, gold and US dollars have been bought since both are preferable to Euros and provided a safe haven.

The key point of this article is not to say that gold will not rise is if the US dollar falls it is to point out that gold is no longer as effective as a USD hedge. In conclusion we hope to have shown that gold simply isn't a clean hedge against the USD any more. When trading one should aim to tailor positions to match your view and optimize the risk/reward dynamics. If we think that the USD is going to fall, short it. If we think gold is going to rise, then buy gold. Taking a long position on gold purely since we think the USD index is going to fall is not really statistically justifiable due to the weakness of the relationship between the two.

Mansukh brings to you the most updated monthly magazine which will help you in understanding online share market but will also help you in doing online stock market trading conveniently and smartly. For all the latest happening of Share market trading, visit www.moneysukh.com. Make more for sure!!!

Related Post about Gold Price

Tuesday, April 19, 2011

Importance of Option Volatility Report By Mansukh

Volatility is a measure of how rapid price changes have been statistical volatility (SV) and what the market expects the price to do implied volatility (IV). When volatility is high, buyers of options should be wary of straight options buying, and they should be looking instead to sell options.

Option ValatilityTrading in options is quite interesting but a trader should have the understandings of the risk involved while trading in option contracts but many beginning options traders never rather understand the serious implications that volatility can have for the options strategies they are considering. Some of the blame for this lack of understanding can be put on the poorly written books on this topic, most of which offer options strategies boilerplate instead of any real insights into how markets actually work in relation to volatility. However, if you're ignoring volatility, you may only have yourself to blame for negative surprises. Many traders, eager to get to the strategies that they believe will provide quick profits, look for an easy way to trade that does not involve too much thinking or research. But in fact, more thinking and less trading can often save a lot of unnecessary pain. However, pain can also be a good motivator, if you know how to process the experiences productively. If you learn from your mistakes and losses, it can teach you how to win at the trading game.

Option Volatility
Volatility is an essential element determining the level of option prices. It is a measure of the rate and magnitude of the change of prices (up or down) of the underlying. If volatility is high, the premium on the option will be relatively high, and vice versa. Once you have a measure of statistical volatility (SV) for any underlying, you can plug the value into a standard options pricing model and calculate the fair market value of an option. Actually volatility are two types historical volatility and implied volatility which is used to determine whether options are expensive (means they trading at prices high relative to spast levels) or cheap.

Importance of Option Volatility
Impact of volatility changes on option trades is good as well as bad. In addition to this so-called Vega risk/reward, in this all parts of the tutorial we'll provide key insights and practical tips about how to use the concepts mentioned above as they relate to volatility and Vega. Virtually volatility of option can be used for the following rationales.

Valuation of Options:  
The most practical aspect of a volatility perspective on options strategies and option prices is the opportunity it affords you to determine relative valuation of options. Due to the nature of markets, options may often price in events that are expected. Therefore, when looking at option prices and considering certain strategies, knowing whether options are "expensive" or "cheap" can provide very useful information about whether you should be selling options or buying them.

Selection of Strategies: 
Another important use of volatility analysis is in the selection of strategies. Every option strategy has an associated Greek value known as Vega, or position Vega. Therefore, as implied volatility levels change, there will be an impact on the strategy performance. Positive Vega strategies (like long puts, backspreads and long strangles/straddles) do best when implied volatility levels rise. Negative Vega strategies (like short options, ratio spreads and short strangles/ straddles) do best when implied volatility is falling. Clearly, knowing where implied volatility levels are and where they are likely to go once in a trade can make all the difference in the outcome of strategy.

Predictor of Price: 
Finally, Implied volatility is also used as a predictor of the future direction of stocks and stock indexes. Actually Implied volatility can be used as a predictor of price from two angles: as a contrarian, when implied volatility has moved too far - high or low - or as a sign of potentially explosive price moves when implied volatility is extremely high for no apparent reason. Typically, the latter occurs when there is a pending unknown or even known event but it is not clear which way the stock will move. All that the extremely high implied volatility tells you is that something big is in the offing.

Conclusion: 
Volatility is a measure of how rapid price changes have been statistical volatility (SV) and what the market expects the price to do implied volatility (IV). When volatility is high, buyers of options should be wary of straight options buying, and they should be looking instead to sell options. Low volatility, on the other hand, which generally occurs in quiet Indian markets, will offer better prices for buyers; however, there's no guarantee the market will make a violent move anytime soon. By incorporating into trading an awareness of IV and SV, which are important dimensions of pricing, you can gain a decisive edge as an options trader.
Mansukh brings to you the most updated monthly magazine which will not only help you in understanding online share market but will also help you in doing online stock market trading conveniently and smartly. For all the latest happening of Share market trading, visit www.moneysukh.com. Make more for sure!!!

Related Post about Volatility Index

Monday, April 18, 2011

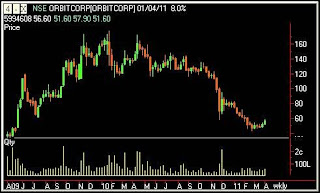
Technical Analysis Orbit Corporation Ltd And Voltas Ltd Report By Mansukh

Moreover it's RSI and other technical indicators stands in the oversold territory where possibility of turnaround couldn't be rule out. Hence investors are advised to BUY this stock for a price target of Rs 200-210 in one month. 

ORBIT CORPORATION LTD
We are optimistic about OCL South-Mumbai focused real estate business model. Despite reporting de-growth in the net profit we still believe company will outperform its peers in the near future. Company stands benefit from the new CRZ norms passed in Jan'11. Under this norm the no-development zone has been reduced to 100 meters from 200 meters. Further with three new projects to be launched in next 2-3 quarters including its two prime projects in the heart of the Island City at Napean Sea Road (0.3msf) and Lalbaug (0.075msf) and one in the Mumbai-suburb micro-market at Santacruz (0.3msf), together these projects provides enough revenue visibility in the near future. At CMP `54, the stock is trading at 6.3x and 4.1x FY12E and FY13E earnings while on P/BV basis the stock is available at 0.5x and 0.4x its FY12E and FY13E book value respectively. We maintain our “Buy” rating however we have revised our target price downward to Rs 70.

On technical perspective, stock market currently shows significant correction from the highs of Rs 91 however we believe it's a temporary one and we might see some buying opportunities in the near term. Nevertheless its technical indicators i.e. RSI and MACD also revealed some technical pull back in near term.

VOLTAS LTD

Voltas has transformed itself from a traditional HVAC (Heating, Ventilation & Air Conditioners) player to a complete MEP (Mechanical, Electrical & Plumbing) player. Being a complete MEP contractor expands the scope of work in total project cost from 15% for HVAC to 35% for MEP by offering services like power systems, fire detection and protection, process refrigeration, public health engineering, indoor air quality and integrated building management in addition to the core HVAC solutions. The EMPS segment has grown at a CAGR of 29.5% over FY05-10 to Rs. 3113.4 Crs and contributes
~60% to the company's total revenues. The segment's current order book stands at Rs. 4697 Crs (31st December 2010). The company expects Rohini Industrial Electrical to turn around by next fiscal which would positively add to the company's margins. With the visible growth prospects in the UCP and EPS division, led by rising infrastructure stock investments coupled with strong order book and good track record, we believe Voltas has strong revenue visibility. At the CMP of Rs.178, the stock is trading at 15.6x and 13.7x its FY11E and FY12E EPS respectively. We recommend BUY on the stock with a target price of Rs. 210, providing an upside of more than 15% from the current levels. On technical viewpoint, stock has shown some consolidation around Rs 155. In close proximity we believe stock is well poised to move in upward direction. Moreover it's RSI and other technical indicators stands in the oversold territory where possibility of turnaround couldn't be rule out. Hence stock investors are advised to BUY this stock for a price target of Rs 200-210 in one month.

Mansukh brings to you the most updated monthly magazine which will not only help you in understanding online share market but will also give you online trading solution conveniently and smartly. For all the latest happening of Share market trading, visit http://moneysukh.com.

Related post Post Budget Analysis Of 2011

Wednesday, April 13, 2011

INDIAN ECONOMY- GROWTH MAY BE TAPPED BY INFLATION, SECTORS SPECIFIC MOVE

Indian Economy
Higher input costs did not restrict Indian manufacturers from improving performance during the year ending March 31. However, risks remain which will put pressure on their profit margins in the coming year, said a survey by industry body CII. According to the chamber's Ascon survey , 41 out of 121 sectors in the survey are estimated to grow at 20% or more in the current financial year, compared to 34 sectors that had reported such growth during 2009-10. The top performers include air conditioners, tractors, fertilisers, construction equipment, tyres, and vehicles among others.

Although the total percentage of sectors reporting double digit growth has increased marginally this fiscal, just a handful of sectors reported lower production compared to one in every five that shrunk in size for the year ended March 2010. Sectors such as tea, asbestos cement, and edible oils are among those that are expected to report negative growth. Sectors that are projected to record high growth (10-20%) for the year ending March'11 include utility vehicles, natural gas, crude oil, power transformers, energy meters, home and personal care products, automation industry, alcoholic beverages and biscuits. As many as 49 sectors, including caustic soda, soda ash, cement, refinery, steel, rubber goods and ceramics, may clock up to 10% growth. During 2009-10, less than half such sectors recorded moderate or single digit growth. India's core sector, comprising of six infrastructure industries, has registered growth of 6.8% in the month of February, raising hopes that the performance of the overall index of industrial production (IIP) will also be better in the month under review. The core sector has a weight of 26.7% in the overall IIP and includes crude oil, petroleum refinery, coal, electricity, cement and steel.

Looking at the individual performance, crude oil with a weight of 4.17% in the IIP recorded the best show with a strong growth of 12.2% in February 2011 against a growth rate of 4.0% in February 2010. Cumulative production of crude production grew 11.9% during AprilFebruary period of current financial year against 0.3% during the same period of the last fiscal. Cement and steel were two better performing sectors indicating that infra activity was finally picking up in country after showing significant slowdown in second half of last year. Cement production (weight of 1.99% in IIP) recorded a growth of 6.5% in the month under review as compared with 7.9% in the same month a year ago. production of finished steel (weight of 5.13 per cent in IIP) on the other hand recorded a growth of 11.5% in February 2011 against a negative (-) 0.2% in February 2010.The cumulative growth in the two industries stands respectively at 4.3% and 8.1%.

Bombay Stock Exchange Realty turned out to be the best sectorial index on the bourses, gaining 8.99% over the past one week. The market saw a change in mood with stocks moving upward. The week saw legendary investor Warren Buffett's maiden visit to India in which he recognized India as an investment destination. The government made its contribution by moving the bills to amend banking sector laws and implementation of goods and service tax. The proposed changes in voting rights in banks ensured that the banking stocks make it to investors' radar. "Traders will keenly watch 5800 level on Nifty. Some profit-taking is expected ahead of expiry of March derivative series. We believe the markets recovery is more likely to pause unless investors follow up last week's unwinding of short positions with delivery-based buying. Moreover the market looks overbought in the short term. The focus in the coming week will be on the extent of rollover in March derivatives contracts to the next month before expiry and developments in the Eurozone.

Mansukh brings to you the most updated monthly magazine which will not only help you in understanding online share market but will also help you in doing online stock market trading conveniently and smartly. For all the latest happening of Share market trading, visit http://moneysukh.com. Make more for sure!!!

India Industrail Output and PMI

Related Post Expectations from the Union Budget 2011-12